Digital Onboarding welcomes proven fintech product leader Nate Shahan as Chief Product Officer > Read the blog

BREAKING NEWS
Digital Onboarding welcomes proven fintech product leader Nate Shahan as Chief Product Officer > Read the blog
BREAKING NEWS

Article

6
min read

You're staring at a dashboard full of impressive numbers—high opens, tons of impressions, solid click-through rates—and a bump in new account openings. Then someone asks the awkward question: "But how many of those new accounts are actually being used?"
Crickets…
Here's the uncomfortable truth: many marketing metrics just make us feel busy without making us successful. This guide is about cutting through the noise and focusing on the numbers that move your institution’s business forward.
Let's be honest—not every number you can measure deserves your attention. We marketers love our dashboards because they give us that dopamine hit when the numbers go up. But here's the thing: high opens with zero activity? Your subject lines work, but your offers don't. People are clicking but finding no value.
Pro-tip: If you can't draw a line from that metric to actual dollars or genuine relationships, question whether it belongs in your report.
We all want opens, clicks, and app visits. But surface-level engagement can be a total mirage—just because someone opens a new account doesn't mean they're on the path to becoming a profitable customer or member.
That's why it's not enough just to count actions; you need to connect them to outcomes that matter.
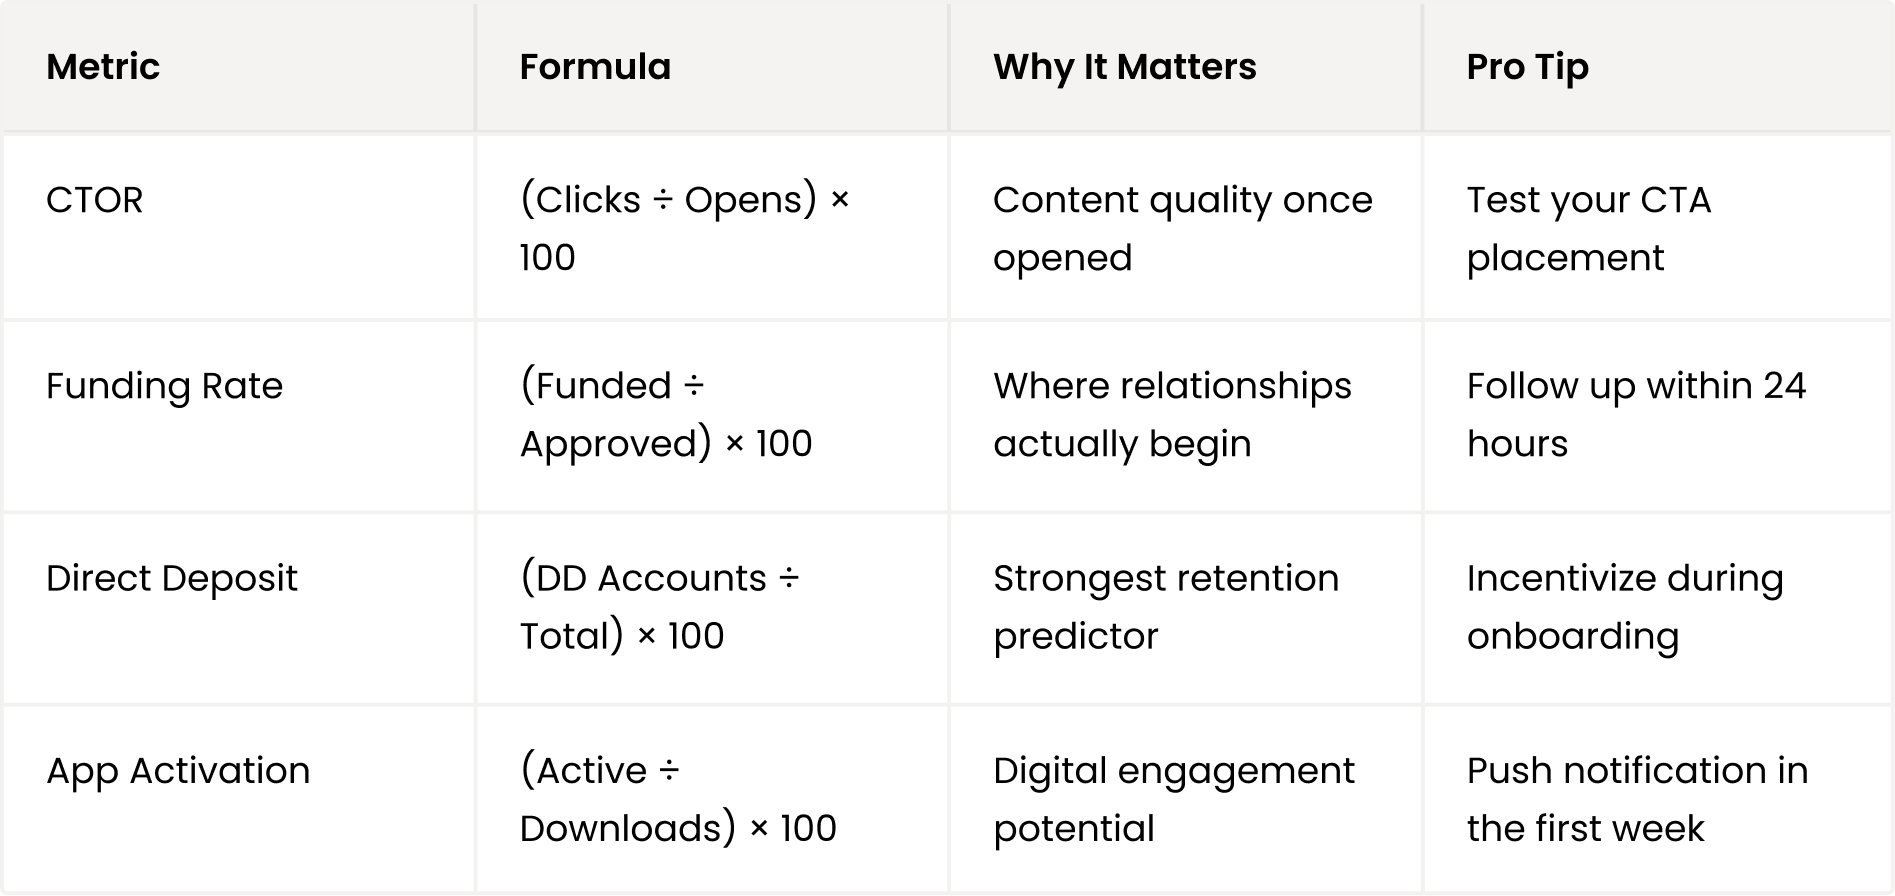
Click-to-Open Rate (CTOR)
Pro tip: Track the meaningful actions each person takes across all your channels. If someone devours your emails but completely ignores app notifications, that's a telling sign about their channel preference.
This is where your marketing stops being "interesting" and starts being valuable. These are the moments when someone goes from curious to committed—and since every step between "thinking about it" and "funded account" is a chance to lose them, these metrics show you exactly where people are bailing out.
Application Completion Rate
Funding Rate
Opening an account is one thing. Turning it into a habit is something else entirely. These are your early-warning signals for whether someone will still be around (and profitable) a year from now.
Direct Deposit Setup Rate
Mobile App Activation
90-Day Activity Score: Create a weighted mix of logins, transactions, and product usage. Think of this as your early warning system for churn before it happens.
Here's where most marketing reports fall entirely flat—they show you "what happened" but never the "so what." A chart showing your click-through rate went up doesn't mean much unless you can tie it directly to account openings and real dollars.
The real litmus test is when you can draw a straight line: Email engagement → Applications → Funded accounts → Balance growth.
Pro tip: Think in dollars, not just percentages. That 5% improvement in completion rates might represent millions in new deposits.
It's not enough to track engagement and conversions—you need to know if those customers are worth what you spent to acquire them.
If your CPA is higher than your LTV, you have a problem that needs fixing immediately.
Industry benchmarks are great starting points, but don't treat them as gospel. Your institution's size, market, and member or customer base can make those "averages" totally irrelevant — there is no one-size-fits-all.
Use benchmarks as your baseline, then layer in your own historical performance and real testing to set targets that are both realistic and ambitious.
Quick reference benchmarks:
Let's be real—half the battle with marketing metrics is getting the data in a way you can practically use it. If your monthly reporting feels like a scavenger hunt through different platforms, no wonder the insights aren't driving action!
In your marketing platforms:
Connect to core banking:
Build dashboards that leadership truly cares about:
Remember: if you can't draw a line from that metric to actual dollars or genuine relationships, it’s a vanity metric. Ditch it.
A report that sits in a shared drive and never changes your behavior is just expensive wallpaper. The real power lies in using these metrics to make smarter, faster decisions.
When something's not working:
When something's working:
Use data to get resources:

Stop celebrating being busy and start measuring impact. These metrics aren't just numbers—they're the story of how well you're serving your members and growing your institution.
Track what matters, tie it to business outcomes, and use those insights to improve continually. Because when you stop chasing vanity and start focusing on value, you don't just get better reports, you get better results.

68 Harrison Ave
#605, PMB 42644
Boston, MA 02111
© 2025 Digital Onboarding, Inc.
68 Harrison Ave
#605, PMB 42644
Boston, MA 02111

.png)
